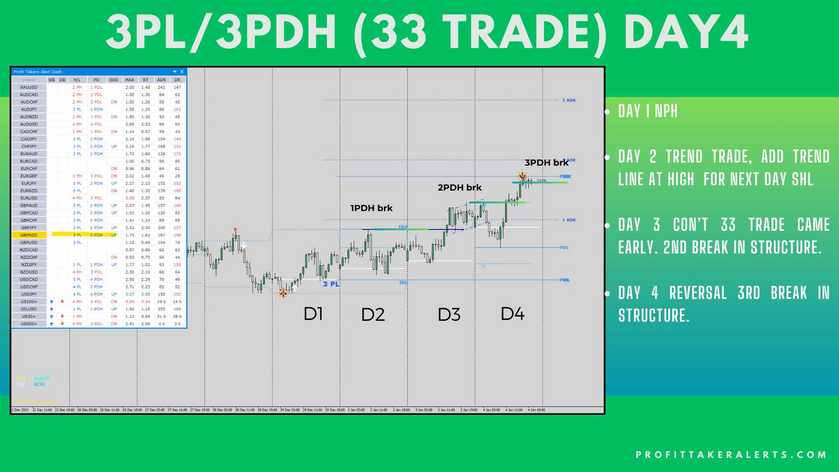
The ABCD trading strategy is a popular technical analysis approach used by traders to identify potential opportunities in the financial markets. This strategy is based on the principle that markets move in a predictable pattern, and by understanding and identifying this pattern, traders can make profitable trades.
The ABCD trading strategy is based on the Fibonacci retracement tool, which is a mathematical sequence that measures the potential retracement of an asset's price after a significant move. The Fibonacci sequence is a series of numbers in which each number is the sum of the two preceding numbers. For example, the first few numbers in the Fibonacci sequence are 0, 1, 1, 2, 3, 5, 8, 13, 21, 34, and so on.
The ABCD trading strategy uses the Fibonacci sequence to identify potential price levels where an asset may reverse its trend. The strategy involves four key points, labeled A, B, C, and D, which correspond to the key levels identified by the Fibonacci retracement tool.
The first point, point A, is the start of a significant move in price, whether up or down. The second point, point B, is the end of the initial move, and it is typically identified by the first significant retracement. The third point, point C, is the level where the retracement ends, and the asset begins to move in the same direction as the initial move. Finally, point D is the level where the asset is expected to reverse its trend, based on the Fibonacci sequence.
To use the ABCD trading strategy, a trader would first identify point A and point B on a chart. They would then use the Fibonacci retracement tool to identify potential levels of retracement, looking for the level where the retracement ends and the asset begins to move in the same direction as the initial move. Once this level is identified as point C, the trader would then use the Fibonacci extension tool to identify potential levels where the asset is expected to reverse its trend, labeled as point D.
Once point D is identified, the trader would look for confirmation of a reversal in price action, using other technical analysis tools such as trend lines, support and resistance levels, and oscillators. If the trader is confident that a reversal is imminent, they would place a trade in the opposite direction of the initial move, with a stop loss at the level of point D and a profit target at the level of point A.
It is important to note that the ABCD trading strategy is not foolproof, and traders should use proper risk management techniques to minimize potential losses. It is also important to keep in mind that the Fibonacci sequence is not a guarantee of future price movements, and market conditions can change rapidly, leading to unexpected results.
In conclusion, the ABCD trading strategy is a popular technical analysis approach used by traders to identify potential opportunities in the financial markets. By using the Fibonacci retracement and extension tools, traders can identify potential levels where an asset may reverse its trend and make profitable trades. However, traders should use proper risk management techniques and be aware that the strategy is not foolproof.

